
Monitoring Setup
Steps followed


shipping
Transferring the server metrics and logs
processing
Parsing the data received
storing
Saving the monitoring data on a DB
visualizing
Generating graphs for the key metrics and errors
alarms
Notifying the Users incase of anomalies


Elasticsearch, Kibana, Beats, and Logstash (also known as the ELK Stack ) and more.
Episyche is a pioneer in setting up monitoring and alerting solutions for SAAS, E-commerce, and Data processing platforms using ELK.
We track the requests throughout their system, and in case of errors, will notify the customers immediately.

Datadog is an observability service for cloud-scale applications, providing monitoring of servers, databases, tools, and services, through a SaaS-based data analytics platform.
Episyche implemented end-to-end application monitoring (i.e Metrics, Service Health check, and API performance ) using data dog.


Grafana is most commonly used as an infrastructure monitoring tool that lets you keep tabs on application performance and error rates.
Prometheus is a free software application used for event monitoring and alerting.
With the combination of Grafana and Prometheus, we have done numerous infra-monitoring setups.

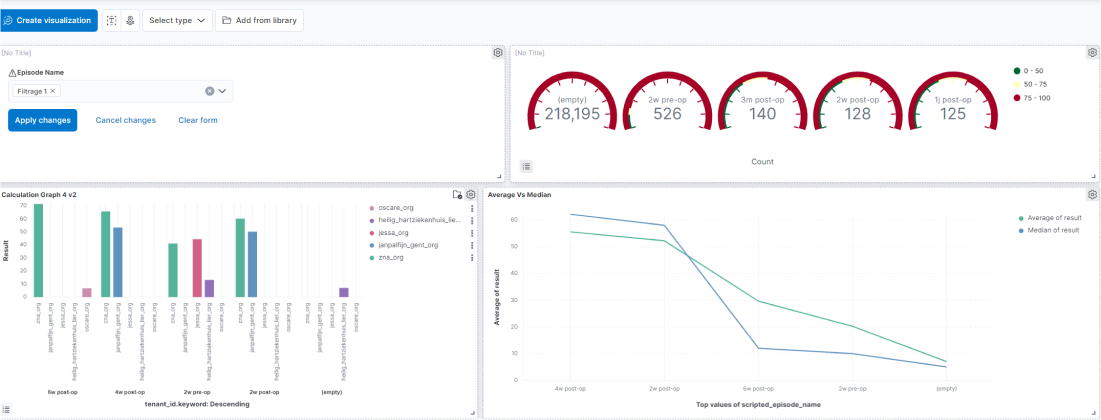
Created a monitoring platform to analyze surgeries performed by doctors across various cities and hospitals in Belgium.


Products
Company
Copyright @2022 Episyche Technologies Pvt Ltd


Subscribe to our Newsletter
The latest news, blogs, and fun memes from the community!
Services
Products
Blog
Contact


Copyright @2022 Episyche Technologies Pvt Ltd